Use FE profiler to generate flame graph
introduce
In versions 2.1.4 and above of Doris, there will be a profile_fe.sh script in the fe deployment directory ${DORIS_FE_HOME}/bin. This script can use the async-profiler tool to generate a flame graph of fe, which can be used to identify the bottleneck points of fe.
Note: The async profiler tool currently only supports Linux and MacOS systems, and does not currently support Windows systems
The usage cases are as follows
$ # By default, monitor FE for 10 seconds to generate a flame graph
$ ${DORIS_FE_HOME}/bin/profile_fe.sh

$ # Set listening fe for 30 seconds to generate a flame graph
$ PROFILE_SECONDS=30 ${DORIS_FE_HOME}/bin/profile_fe.sh
After running the above command, it will listen to fe for a period of time. During this period, we need to repeatedly send key queries to this FE so that the async-profiler can collect FE's key stack frame information.
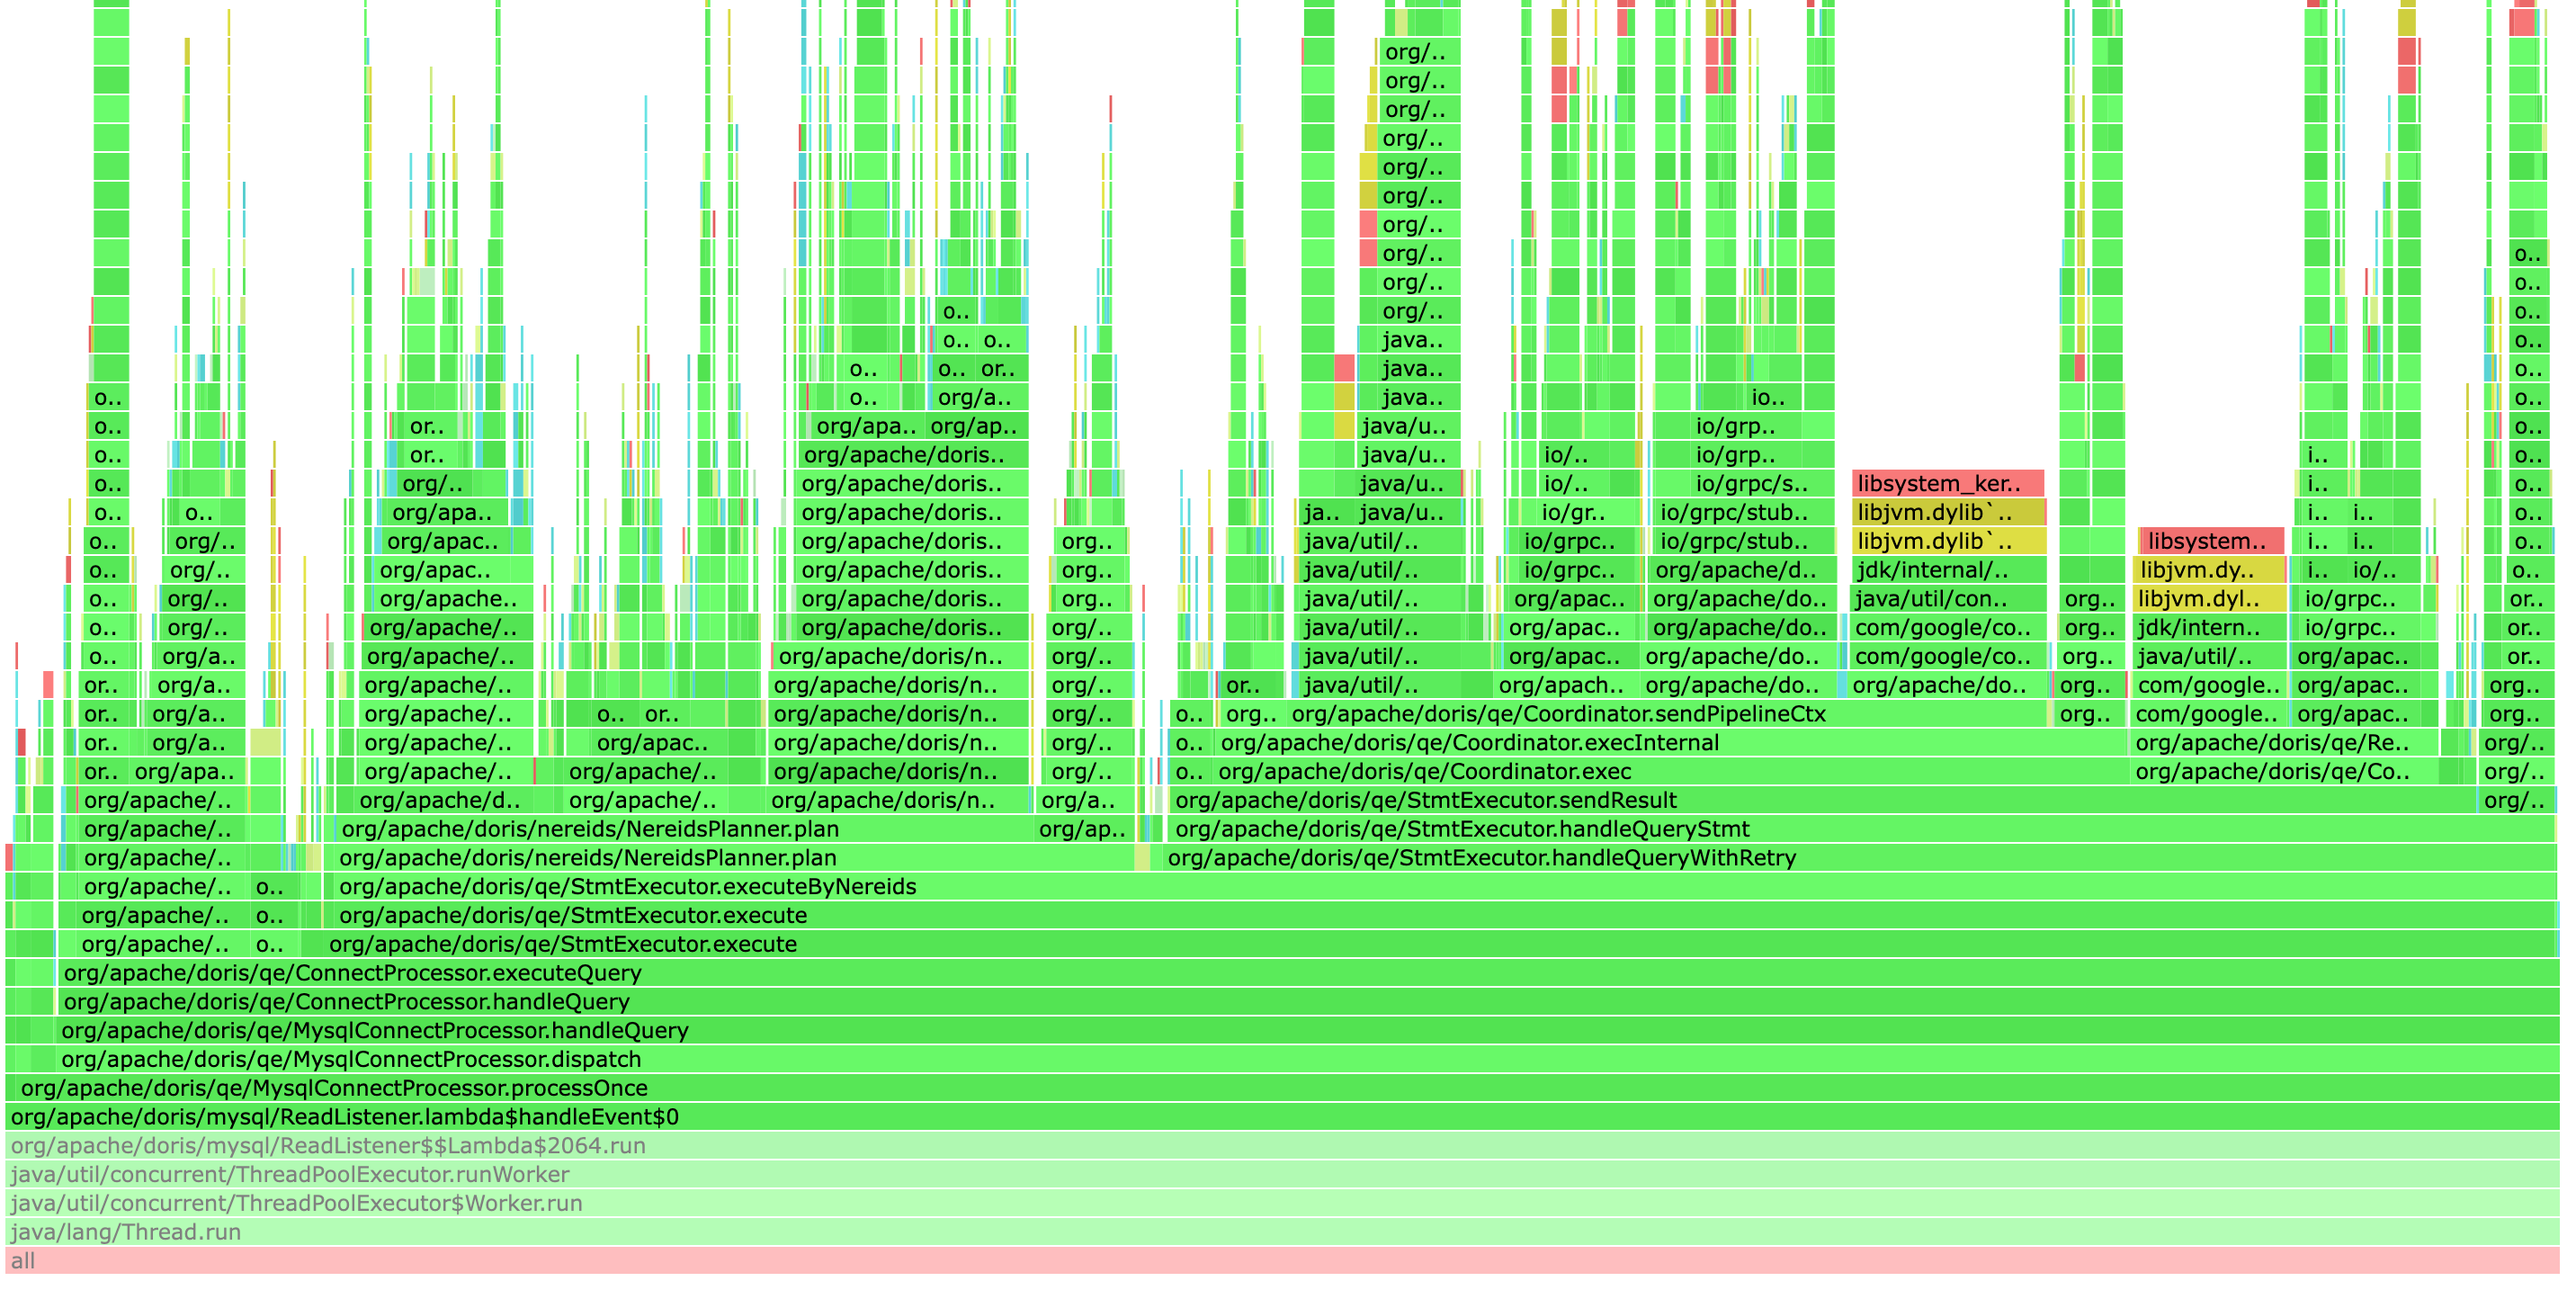
After collecting stack frame information, the script will generate an HTML flame graph file in the ${DORIS_FE_HOME}/log directory. Generally, the bottleneck of fe will appear as a flat top (short and wide) in the flame graph. We can optimize the performance of the code corresponding to these stack frames.
The following is an example of a flame graph
Using async-profiler in lower versions of fe
In versions below 2.1.4, two files need to be manually downloaded
- Download ap-loader-all-3.0-8.jar to the
${DORIS_FE_HOME}/libdirectory - Download profile_fe.sh to the
${DORIS_FE_HOME}/bindirectory - Just run
profile_fe.sh
