Memory management features
This document will introduce some of Doris's memory management features to help better analyze memory problems.
As an OLAP database based on MPP architecture, Apache Doris will stream and calculate between operators after loading data from disk to memory, and store the intermediate results of calculation in memory. This method reduces frequent disk I/O operations, makes full use of the parallel computing capabilities of multiple machines and multiple cores, and can show huge advantages in performance.
When facing complex calculations and large-scale operations with huge memory resource consumption, effective memory allocation, statistics, and control play a very critical role in the stability of the system - faster memory allocation speed will effectively improve query performance, and memory allocation, tracking and restriction can ensure that there are no memory hotspots, respond to insufficient memory in a timely and accurate manner, and avoid OOM and query failures as much as possible. This series of mechanisms will significantly improve system stability; at the same time, more accurate memory statistics are also the basis for large queries to fall to disk.
Doris memory data structure
The allocation of large blocks of memory during query execution is mainly managed by the three data structures of Arena, HashTable, and PODArray.
Arena
Arena is a memory pool that maintains a list of memory blocks and allocates memory from it to respond to alloc requests, thereby reducing the number of times memory is requested from the system to improve performance. Memory blocks are called Chunks, which exist throughout the life cycle of the memory pool and are uniformly released during destruction, which is usually the same as the query life cycle. They also support memory alignment and are mainly used to save serialized/deserialized data during the Shuffle process, serialized Keys in HashTable, etc.
Chunks are initially 4096 bytes, and cursors are used internally to record the allocated memory locations. If the remaining size of the current Chunk cannot meet the current memory request, a new Chunk is requested and added to the list. To reduce the number of times memory is requested from the system, when the current Chunk is less than 128M, the size of each newly requested Chunk is doubled. When the current Chunk is greater than 128M, the size of the newly requested Chunk is allocated at most 128M on the premise of meeting the current memory request, to avoid wasting too much memory. By default, the previous Chunk will no longer participate in subsequent alloc.
HashTable
HashTable in Doris is mainly used in Hash Join, aggregation, set operation, and window function. The main PartitionedHashTable used contains up to 16 sub-HashTables, supports parallel merging of two HashTables, and each sub-Hash Join is independently expanded, which is expected to reduce the use of total memory, and the delay during expansion will also be amortized.
When the HashTable is less than 8M, it will be expanded by a multiple of 4, and when the HashTable is greater than 8M, it will be expanded by a multiple of 2. When the HashTable is less than 2G, the expansion factor is 50%, that is, the expansion is triggered when the HashTable is filled to 50%, and the expansion factor is adjusted to 75% after the HashTable is greater than 2G. In order to avoid wasting too much memory, the HashTable is usually pre-expanded according to the amount of data before building it. In addition, Doris designs different HashTables for different scenarios, such as using PHmap to optimize concurrent performance in aggregation scenarios.
PODArray
PODArray is a dynamic array of POD type. It is different from std::vector in that it does not initialize elements, supports some std::vector interfaces, supports memory alignment and expansion in multiples of 2. When PODArray is destructed, it does not call the destructor of each element, but directly releases the entire block of memory. It is mainly used to save data in columns such as String. In addition, it is also widely used in function calculation and expression filtering.
Doris Allocator
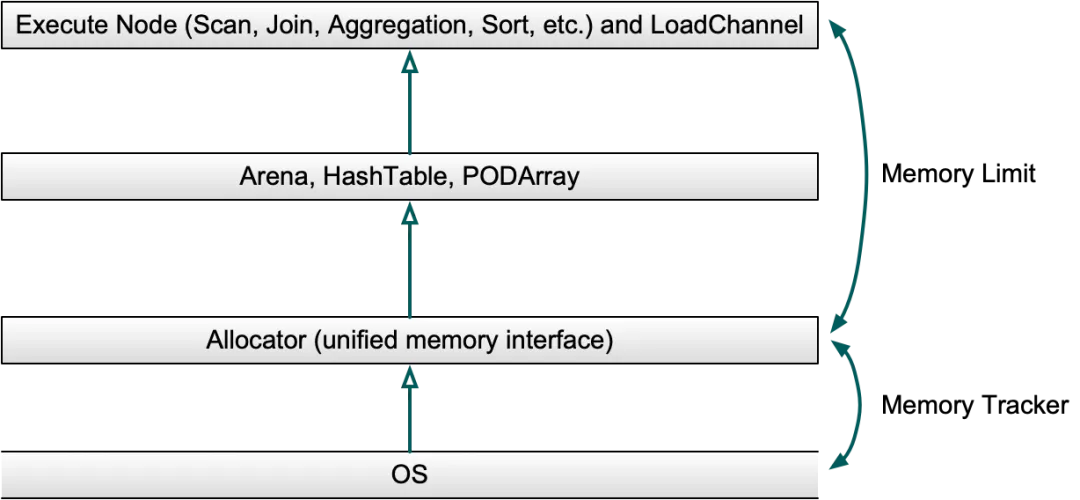
Allocator is the unified entry for large-block memory applications in the system. It applies for memory from the system and uses MemTracker to track the size of memory application and release during the application process. The large memory required for batch application of operators will be managed by different data structures, and the process of limiting memory allocation will be intervened at the right time to ensure efficient and controllable memory application.
The core concept of early Apache Doris memory allocation was to take over the system memory as much as possible and manage it by itself, using a general global cache to meet the performance requirements of large memory applications, and caching data such as Data Page, Index Page, RowSet Segment, Segment Index in the LRU Cache.
As Doris uses Jemalloc to replace TCMalloc, Jemalloc's concurrency performance is good enough, so it does not continue to take over the system memory in full within Doris. Instead, it uses multiple memory data structures and accesses a unified system memory interface to achieve unified memory management and local memory reuse based on the characteristics of memory hotspots.
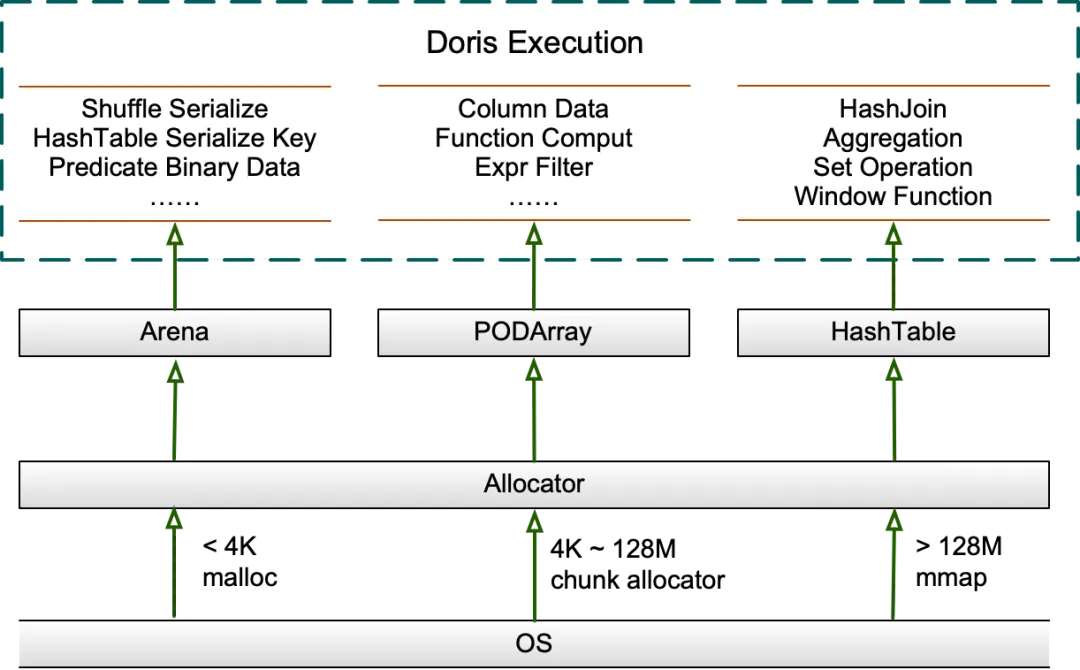
Allocator is a unified memory interface for Arena, PODArray, and HashTable. It uses MMAP to apply for memory larger than 64M and accelerates performance through prefetching. It directly applies for memory smaller than 4K from the system through malloc/free. It uses a general cache ChunkAllocator to accelerate memory larger than 4K and smaller than 64M. This can bring a 10% performance improvement in the Benchmark test. ChunkAllocator will first obtain a Chunk of a specified size from the FreeList of the current Core without locks. If it does not exist, it will obtain it from the FreeList of other Cores with locks. If it still does not exist, it will apply for a specified memory size from the system and encapsulate it into a Chunk before returning.
Allocator uses a general memory allocator to apply for memory. In the choice of Jemalloc and TCMalloc, Doris previously used TCMalloc's CentralFreeList Spin Lock to account for 40% of the total query time in high-concurrency tests. Although turning off aggressive memory decommit can effectively improve performance, it will waste a lot of memory, so a separate thread has to be used to periodically recycle TCMalloc's cache. Jemalloc performs better than TCMalloc under high concurrency and is mature and stable. In Doris 1.2.2, we switched to Jemalloc. After tuning, the performance is on par with TCMalloc in most scenarios, and it uses less memory, and the performance of high-concurrency scenarios is also significantly improved.
Memory reuse
Doris does a lot of memory reuse at the execution layer, and visible memory hotspots are basically blocked. For example, the reuse of data blocks runs through the entire query execution; for example, the Sender end of Shuffle always keeps one Block to receive data, and one Block is used in RPC transmission, and the two Blocks are used alternately; and the storage layer reuses the predicate column to read, filter, copy to the upper layer Block, and clear when reading a Tablet; when importing the Aggregate Key table, the MemTable of cached data reaches a certain size and then continues to write after pre-aggregation and shrinkage, etc.
In addition, Doris will pre-allocate a batch of Free Blocks based on the number of Scanners and threads before the data Scan starts. Each time the Scanner is scheduled, a Block will be obtained from it and passed to the storage layer to read the data. After the reading is completed, the Block will be placed in the producer queue for consumption by the upper-layer operator and subsequent calculation. After the upper-layer operator copies the data, it will put the Block back into the Free Block for the next Scanner scheduling, thereby realizing memory reuse. After the data Scan is completed, the Free Block will be uniformly released in the previously pre-allocated threads to avoid the extra overhead caused by memory application and release in different threads. The number of Free Blocks also controls the concurrency of data Scan to a certain extent.
Memory limit and watermark calculation method
Process memory limit MemLimit =
be.conf/mem_limit * PhysicalMemory, the default is 90% of the total system memory.Process memory soft limit SoftMemLimit =
be.conf/mem_limit * PhysicalMemory * be.conf/soft_mem_limit_frac, the default is 81% of the total system memory.System remaining available memory low water mark LowWaterMark =
Max(a, b, c), on a machine with 64G memory, LowWaterMark defaults to slightly less than 3.2 GB, wherea = PhysicalMemory - MemLimit;b = PhysicalMemory * 0.05;c = be.conf/max_sys_mem_available_low_water_mark_bytes, default is 6.4 GB.System remaining available memory warning water mark WarningWaterMark =
2 * LowWaterMark, on a machine with 64G memory,WarningWaterMarkdefaults to slightly less than 6.4 GB.
Memory GC
Doris BE will periodically obtain the physical memory of the process and the current available memory of the system from the system, and collect snapshots of all query, import, and compaction task MemTracker. When the BE process memory exceeds the limit or the system has insufficient available memory, Doris will release the cache and terminate some queries or imports to release memory. This process is executed regularly by a separate GC thread.
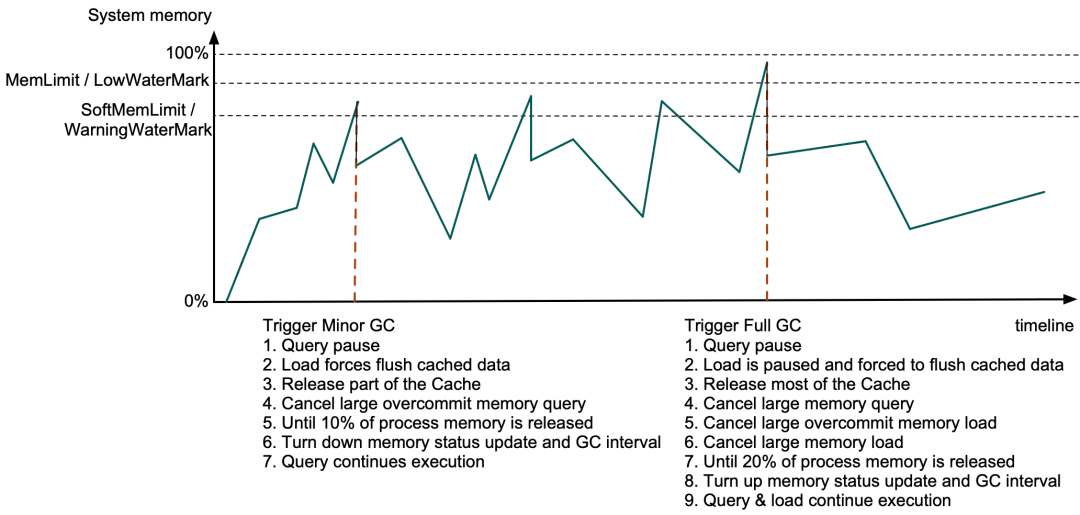
Minor GC is triggered when the Doris BE process memory exceeds SoftMemLimit (81% of the total system memory by default) or the remaining available system memory is lower than the Warning watermark (usually no more than 3.2GB). At this time, the query will be paused when the Allocator allocates memory, and the data in the forced cache will be imported and some Data Page Cache and expired Segment Cache will be released. If the released memory is less than 10% of the process memory, if query memory over-issuance is enabled, the query with a large memory over-issuance ratio will be canceled until 10% of the process memory is released or no query can be canceled, and then the system memory status acquisition interval and GC interval will be lowered. Other queries will continue to execute after the remaining memory is found.
If the BE process memory exceeds MemLimit (90% of the total system memory by default) or the remaining available system memory is lower than the Low watermark (usually no more than 1.6GB), Full GC is triggered. In addition to the above operations, the import will also be paused when the cache data is forced to be flushed, and all Data Page Cache and most other caches will be released. If the released memory is less than 20%, it will start to search in the MemTracker list of all queries and imports according to a certain strategy, and cancel queries with large memory usage, imports with large memory over-issuance ratios, and imports with large memory usage in turn until 20% of the process memory is released. Then, the system memory status acquisition interval and GC interval are increased, and other queries and imports will continue to execute. The GC time is usually between hundreds of us and tens of ms.
Calculation of remaining available memory in the system
When the available memory in the error message is less than the low water mark, it is also treated as a process memory overrun. The value of the available memory in the system comes from MemAvailable in /proc/meminfo. When MemAvailable is insufficient, continuing to apply for memory may return std::bad_alloc or cause BE process OOM. Because refreshing process memory statistics and BE memory GC have a certain lag, a small part of the memory buffer is reserved as the low water mark to avoid OOM as much as possible.
Among them, MemAvailable is the total amount of memory that can be provided to the user process without triggering swap as much as possible, given by the operating system after comprehensively considering the current free memory, buffer, cache, memory fragmentation and other factors. A simple calculation formula: MemAvailable = MemFree - LowWaterMark + (PageCache - min(PageCache / 2, LowWaterMark)), which is the same as the available value seen by cmd free. For details, please refer to:
why-is-memavailable-a-lot-less-than-memfreebufferscached
The default low water mark is 3.2G (1.6G before 2.1.5), which is calculated based on MemTotal, vm/min_free_kbytes, confg::mem_limit, config::max_sys_mem_available_low_water_mark_bytes, and avoids wasting too much memory. Among them, MemTotal is the total system memory, and its value is also taken from /proc/meminfo; vm/min_free_kbytes is the buffer reserved by the operating system for the memory GC process, and its value is usually between 0.4% and 5%. On some cloud servers, vm/min_free_kbytes may be 5%, which will make the system available memory appear to be less than the actual value; increasing config::max_sys_mem_available_low_water_mark_bytes will reserve more memory buffer for Full GC on machines with more than 64G memory, and decreasing it will make the memory as fully utilized as possible.
